 User's Guide
 PART 3. Java in the Database
 CHAPTER 19. Debugging Java in the Database
This section takes you through a simple debugging session.
 Prepare the database
To prepare the sample database for this tutorial, you should run the script jdemo.sql, which installs the Java examples into the database. The class we use in this tutorial is the JDBCExamples class.
 For instructions on how to install the Java examples, see Installing the Java examples.
 For a discussion of the JDBCExamples class and its methods, see Data Access Using JDBC.
 Prepare to run the Java debugger
Before you can run the debugger, you should ensure that your CLASSPATH environment variable can locate the classes it requires.
 To set your CLASSPATH environment variable:
The Sybase Java debugger is the file Debug.jar, installed in the Java subdirectory of your Adaptive Server Anywhere installation directory. If it is not already present, add this file to your CLASSPATH environment variable.
The debugger uses the Sybase jConnect JDBC driver to connect to the database. Sybase jConnect is the file jdbcdrv.zip in the Java subdirectory of your Adaptive Server Anywhere installation directory. If it is not already present, add this file also to your CLASSPATH environment variable.
Your CLASSPATH environment variable may look as follows after adding these files:
path\Java\Debug.jar;path\Java\jdbcdrv.zip;\jdk1.1.3\lib\classes.zip
where path is your Adaptive Server Anywhere installation directory.
Now you are ready to start the debugger.
 Start the Java debugger
The debugger runs on your client machine. As it is a Java application itself, it is run using your Java Virtual machine.
You can start the Java debugger from the command line or from Sybase Central.
 To start the Java debugger from Sybase Central:
Start Sybase Central (Windows Edition) and open the Utilities folder, under Adaptive Server Anywhere.
Double-click the Java debugger icon in the right panel.
 To start the Java debugger from a system prompt:
From a system command prompt, change directory to your Adaptive Server Anywhere installation directory.
Enter the following command to run the Java VM (java.exe) using the debugger class:
java sybase.vm.Debug
The sybase.vm.Debug class is held in the Debug.jar file.
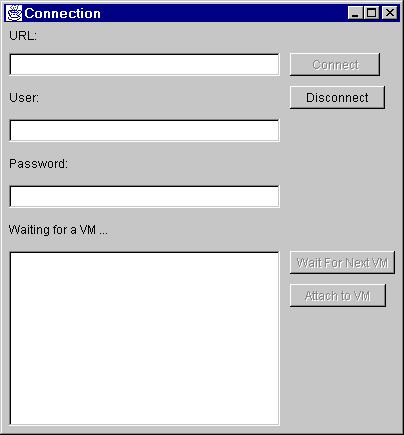
When you have started the Java debugger, the Connection window appears:

You can now connect to a database from the debugger.
 Connect to the sample database
To connect to a database, you need to supply a URL, a user ID, and a password. This section describes by example how to connect.
 To connect to the sample database from the debugger:
Start a personal database server on the sample database. You can do this from the Start menu or by entering the following command at a system prompt:
dbeng6 -c 8M path\asademo.db
where path is your Adaptive Server Anywhere installation directory.
In the Java debugger, enter the following URL:
jdbc:sybase:Tds:localhost:2638
 The meaningsof the components of this URL are described in Supplying a URL for the server.
Enter the user ID DBA and the password SQL and click Connect to connect to the database.
 Once the connection is established, the debugger window displays the message Waiting for a VM. This is because no VM is currently running in the database under the dba user ID. If the dba user ID had one or more current connections carrying out Java operations, one VM for each connection would be listed in the VM list box.
 Attach to a VM
Here, we start a VM for the dba user ID. You cannot start Java execution from the debugger. To start a VM you must carry out a Java operation from another connection under the same user ID.
 To attach to a VM:
With the debugger running, connect to the sample database from Interactive SQL as user ID DBA.
Execute some Java code using the following statement:
SELECT JDBCExamples.Query()
The Sybase Java VM starts in order to retrieve the Java objects from the table. The debugger immediately stops execution of the Java code. You will see that the command in ISQL does not complete (the Execute button is grayed out, and no result set is displayed).
The debugger Connection window lists the VM in its list of available VMs.
In the debugger Connection window, click the VM and click Attach to VM. The debugger attaches to the VM and the Source window appears. At this point the Connection window disappears.
The Source window is empty. The next step is to enable the Source window to show the source code for the method. The source code is available on disk.
 Load source code into the debugger
The debugger looks in a set of locations for source code files (with .java extension). You need to add the jxmp subdirectory of your installation directory to the list of locations, so that the code for the class currently being executed in the database is available to the debugger.
 To add a source code location to the debugger:
From the Source window, select File->Source Path. The Source Path window displays.
From the Source Path window, select Path->Add. Enter the following location into the text box:
path\jxmp
where path is the name of your Adaptive Server Anywhere installation directory.
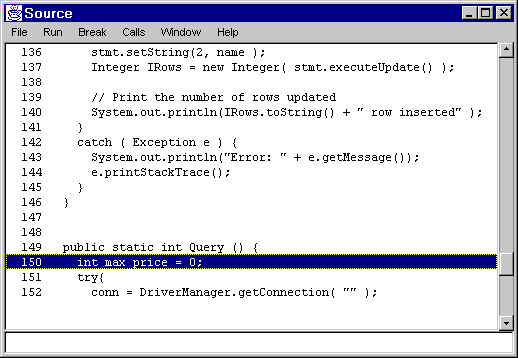
The source code for the JDBCExamples class displays in the window, with the first line of the Query method highlighted. The Java debugger has stopped execution of the code at this point.

You can now close the Source Path window.
 Step through source code
You can step through source code in the Java debugger in several ways. In this section we illustrate the different ways you can step through code using the Query method.
When execution pauses at a line until you provide further instructions, we say that the execution breaks at the line. The line is a breakpoint. Stepping through code is a matter of setting explicit or implicit breakpoints in the code, and executing code to that breakpoint.
Following the previous section, the debugger should have stopped execution of JDBCExamples.Query at the first statement:
Here are some example steps you can try:
Step to the next line Press F7 to step to the next line in the current method. Try this two or three times.
Run to a selected line Select the following line (line 284) using the mouse, and press F6 to run to that line and break:
max_price = price;
Set a breakpoint and execute to it Select the following line (line 292) and press F9 to set a breakpoint on that line:
return max_price;
An asterisk appears in the left hand column to mark the breakpoint. Press F5 to execute to that breakpoint.
Experiment Try different methods of stepping through the code. End with F5 to complete the execution.
When you have completed the execution, the Interactive SQL Data window displays the value 24.
The complete set of options for stepping through source code are displayed on the Run menu. They include the following:
Function |
Shortcut key |
Description |
|---|---|---|
Run |
F5 |
Continue running until the next breakpoint, until the Stop item is selected, or until execution finishes. |
Step Over |
F7 or Space |
Step to the next line in the current method. If the line steps into a different method, step over the method, not into it. Also, step over any breakpoints within methods that are stepped over. |
Step Into |
F8 or i |
Step to the next line of code. If the line steps into a different method, step into the method. |
Step Out |
F11 |
Complete the current method, and break at the next line of the calling method. |
Stop |
Break execution. |
|
Run to Selected |
F6 |
Run until the currently selected line is executed and then break. |
Home |
F4 |
Select the line where the execution is broken. |
 Inspecting and modifying variables
You can inspect the values of both local variables (declared in a method) and class static variables in the debugger.
You can inspect the values of local variables in a method as you step through the code, to better understand what is happening. You must have compiled the class with the javac -g option to do this.
 To inspect and change the value of a variable:
Set a breakpoint at the first line of the JDBCExamples.Query method. This line is as follows:
int max_price = 0
In Interactive SQL, enter the following statement again to execute the method:
SELECT JDBCExamples.Query()
The query executes only as far as the breakpoint.
Press F7 to step to the next line. The max_price variable has now been declared and initialized to zero.
From the Source window, select Window->Locals. The Local window appears.
The Locals window shows that there are several local variables. The max_price variable has a value of zero. All others are listed as not in scope, which means they are not yet initialized.
In the Source window, press F7 repeatedly to step through the code. As you do so, the values of the variables appear in the Locals window.
If a local variable is not a simple integer or other quantity, then as soon as it is set a + sign appears next to it. This means the local variable has fields that have values. You can expand a local variable by double-clicking the + sign or setting the cursor on the line and pressing Enter.
Complete the execution of the query to finish this exercise.
You can also modify values of variables from the Locals window.
 To modify a local variable:
In the debugger Source window, set a breakpoint at the following line in the Query method of the JDBCExamples class:
int max_price = 0
Step past this line in the execution.
Open the Locals window. Select the max_price variable, and select Local->Modify. Alternatively, you can set the cursor on the line and press Enter.
Enter a value of 45 in the text box, and click OK to confirm the new value. The max_price variable is set to 45 in the Locals window.
From the Source window, press F5 to complete execution of the query. In the Interactive SQL Data window, the value 45 is returned from the function.
You can also inspect the values of class-level variables (static variables).
 To inspect a static variable:
From the debugger Source window, select Window->Classes. The Classes window is displayed.
Select a class in the left hand box. The methods and static variables of the class are displayed in the right hand boxes.
Select Static->Inspect. The Inspect window is displayed. It lists the variables available for inspection.
